A Tour of AxoGraph's Main Features
Organize
Group Traces
When a graph window contains multiple traces, they can be grouped into sub-windows for display and analysis...
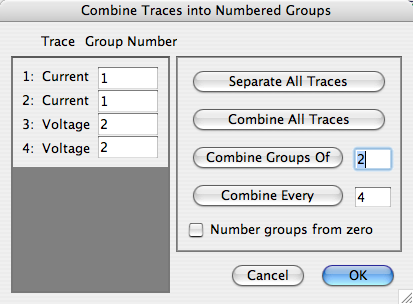
A single button click can automatically regroup traces.
In complex situations, group numbers can be entered manually.
Groups of traces are displayed in sub-windows of a graph window
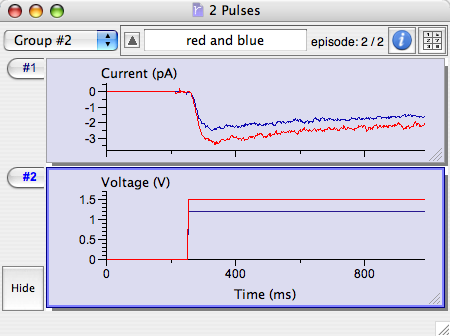
Group sub-windows can be moved and resized manually, or they can be automatically tiled or stacked. A group can be temporarily hidden, which prevents both display and analysis.
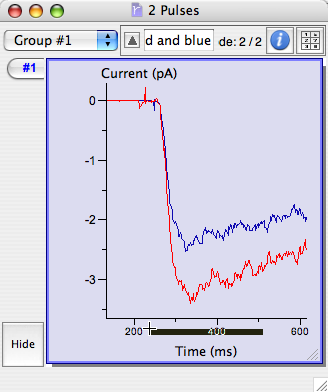
Browse Episodes
- When multiple traces are combined into a group, each trace is termed an 'episode'
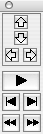
- Episodes can be conveniently browsed using the keyboard or the navigation toolbar
- The comma key, (',' or '<') displays the first episode
- The period key ('.' or '>') displays the last episode
- The 'tab' key displays the next episode after erasing the graph
- the 'space bar' key displays the next episode with no erase
Most analysis features are only applied to the displayed episodes. This provides a convenient method for selecting a series of episodes to display and analyze.
Mask Episodes
The 'browse then analyze' approach is ineffective when a data set containing a handful of randomly distributed corrupt episodes. In this situation, you can 'mask' the problem episodes. This can be achieved by browsing through the episodes with the 'tab' key, visually identifying corrupt episodes, then using the 'Mask Displayed Episode' feature (Cmd-/).
In some situations, the episodes that need to be masked are known in advance. This can be achieved in a single action using the 'Mask Selected' feature. A list of episodes numbers is typed into the Mask Selected dialog (for example, 1 3 5-7 9-13).
Masking episodes can be automated, based on amplitude, rise-time, half-width and other shape parameters.
Zoom
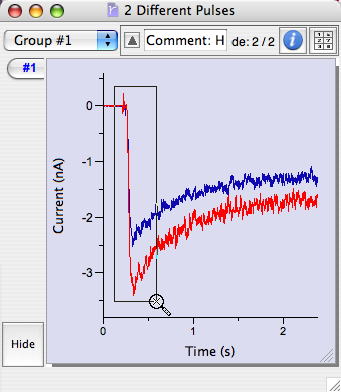
Drag out a rectangle to zoom in on the selected region, or drag along an axis to zoom only one dimension.
- drag out a region to zoom in
- double-click to zoom out
- undo multiple zooms
- drag out a range in X or Y axis to zoom in only one dimension
- triple-click to reset X and Y axes to default values (full range of data)
 |
 |
| Drag out a box in the graph to zoom X and Y | Drag out a bar in the axis to zoom X only |
Scroll
- Arrow keys scroll the graph left or right, up or down
- Holding the 'shift' key down scrolls by one axis width
- A toolbar can also be used to scroll the graph, or browse episodes...
Window Management
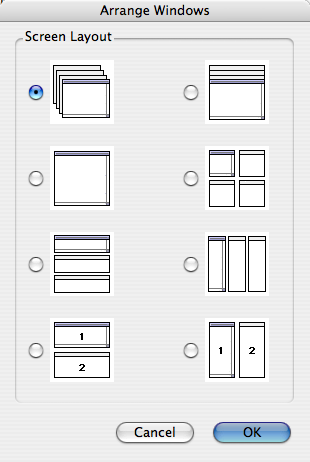
Windows can be automatically arranged in a variety of ways.
- 'Pile' expands each window to fill the screen and piles them on top of one another
- 'Tile' arranges them in a square grid so that every graph is completely visible
- 'Cascade' offsets each window below the previous window so that every title bar is visible
- 'Arrange' offers all these choices plus a few more via this dialog...