Technical Support
Automated Threshold Detection for Auditory Brainstem Responses
A customer requested a new plug-in program to facilitate analysis of ABR data. Development of the plug-in took only four hours for a total fee of $320.
Background
Auditory brainstem responses (ABRs) are used to study auditory acuity in animal-based medical research. ABRs are evoked by acoustic stimuli, and consist of an electrical signal resulting from summated activity in the auditory nerve and brainstem nuclei. ABR analysis determines the sound intensity at which a neural response first appears (hearing threshold). Traditionally, threshold has been estimated by visual assessment of a series of ABRs evoked by different sound intensities. An AxoGraph plug-in implements an automated threshold detection method that eliminates the variability and subjectivity associated with visual estimation. It also reduces the tedium of repetitious data analysis. The plug-in is free, and the threshold detection algorithm that it uses is described in a peer-reviewed methods paper published in BMC-Neuroscience.
How to Install the ABR Plug-In
AxoGraph should already be installed. You can download the installer (via the Download tab at the top of this page). The first time AxoGraph is launched, you will begin a two month fully-functional trial period.
To install the plug-in...
- Download the ABR plug-in program by clicking here.
- A file named 'ABR_Threshold.zip' will be downloaded
- Unzipping this file results in a plug-in file named 'ABR_Threshold.axtx'
- This file must be placed in the AxoGraph 'Plug-In Programs' folder, as follows...
- Locate the folder containing the AxoGraph application
- On a Mac, 'AxoGraph X' is found in the 'Applications' folder of the main hard drive
- Under Windows, 'AxoGraph X' is found in the 'Program Files' directory of the C: drive
- Inside the 'AxoGraph X' folder there is a folder named 'Plug-In Programs'
- Move the file 'ABR_Threshold.axtx' file into this folder
How to Run the ABR Plug-In Program
- Launch the AxoGraph application
- Open a file containing a series of averaged ABR traces, each one recorded at a different sound level
- If averaged ABR traces are in separate files, then open all files and select
'Utilities -> Graph Utilities -> Combine Open Graphs'
- If averaged ABR traces are in separate files, then open all files and select
- The sound intensity in dB should be included in the title of each trace
- To add sound intensity in dB to trace titles, select 'Group -> Separate Traces'
double-click each title to edit, then select 'Group -> Merge Traces'
- To add sound intensity in dB to trace titles, select 'Group -> Separate Traces'
- Click the 'Program' menu, then select the menu item 'Automatically Measure ABR Signal to Noise Ratio'
- This runs the ABR threshold detection program
- Specify the threshold criterion. The default value is a signal-to-noise ratio of 4.
- Specify the time range for estimating background noise
- Specify the time range to search for the peak ABR response
The program will generate a plot of signal-to-noise versus sound intensity in dB as shown.
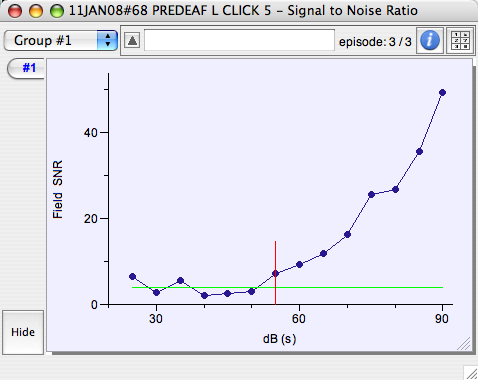
An estimate of the hearing threshold is shown as a vertical red line, and the threshold criterion is shown as a horizontal green line. The hearing threshold estimate is also sent to the log window as a numerical result.