A Tour of AxoGraph's Main Features
Acquire
Continuous Acquisition
In 'Chart' mode, signals are recorded continuously and displayed in a scrolling graph window. The display range can be changed on the fly, without interrupting the recording. Event "tags" can be added to the recording. A regular stimulus or timing pulse can be delivered during the recording.
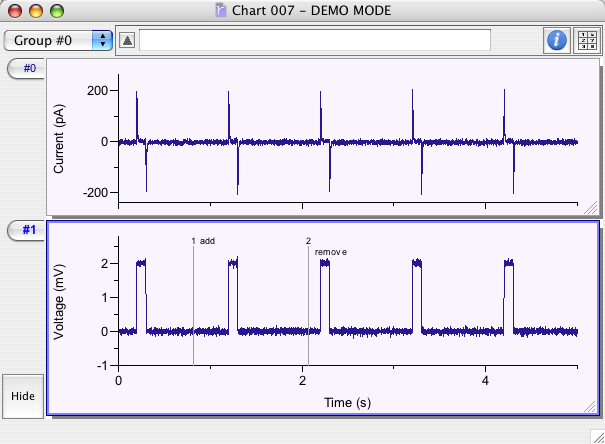
Continuous recording in Chart mode
Episodic Acquisition
In 'Scope' mode, signals are recorded as a series of short time intervals (sweeps). Features include signal averaging and real-time baseline subtraction (emulates AC coupling). The display range can be changed on the fly using "hot-keys". Sweeps can be triggered at regular intervals or when a signal on any channel crosses a specified threshold. A stimulus or synchronizing pulse can be delivered to an output channel during each sweep.
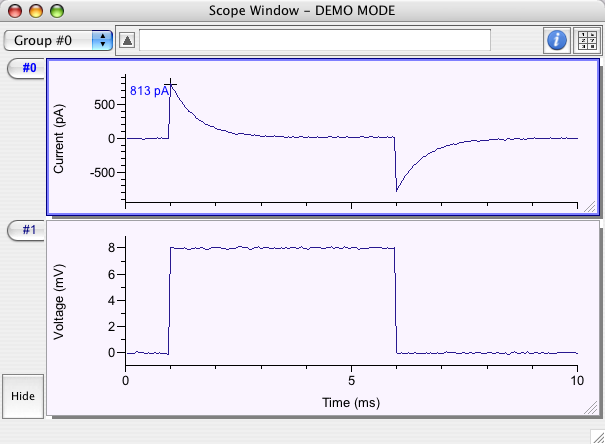
Monitor brief recurring signals in Scope mode
Test-Pulse Window Monitors the Seal Resistance or Cell Membrane Parameters
The test-pulse window is a useful tool for electrophysiologists. It can monitor patch electrode resistance during seal formation, or it can monitor the electrical parameters defining the quality of a whole-cell recording. These are the electrode series resistance, the membrane resistance and capacitance of the cell. The test-pulse program estimates these parameters by fitting an exponential (shown in red) to the decaying phase of the response to a voltage-clamp step.
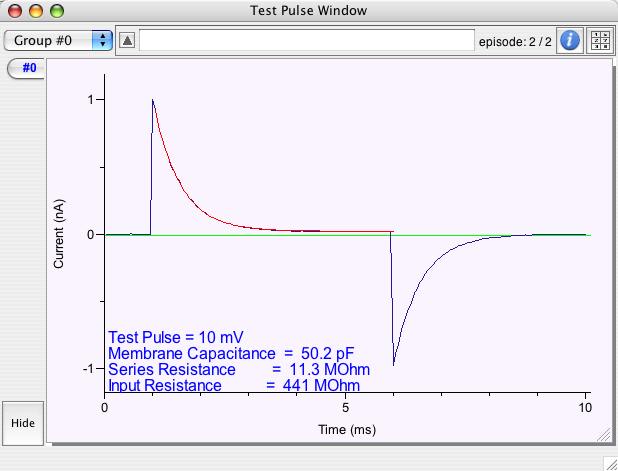
Test Pulse monitors passive electrical properties of a neuron
Data Acquisition with Flexible Stimulus Patterns and P/N Leak Subtraction
The most sophisticated component of the data acquisition package is the protocol-driven acquisition program. It can monitor and record signals from up to 32 input channels (16 analog and 16 digital), while sending a complex series of waveforms to analog and digital output channels. Data acquisition is controlled by a "protocol", which is simply a graph file that contains a series of output waveforms. The protocol also determines which input channels will be recorded, how many episodes to acquire, etc.
Example protocols supplied with AxoGraph demonstrate many of the available features.
There are protocols for...
- delivering a regular stimulus while monitoring response amplitude
- recording a current-voltage relationship while performing online I-V analysis
- delivering a "chirp" output waveform (modulated sinusoid)
- induction of long term synaptic potentiation (LTP)
- and many more
Protocols can be linked together in a chain so that they execute one after another. This permits the design of complex stimulus and recording paradigms.
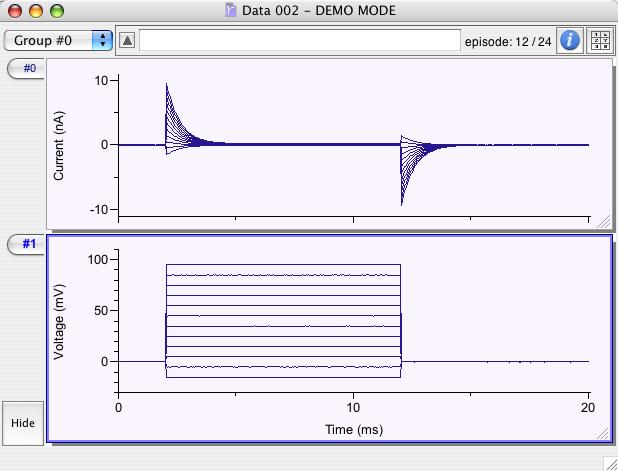
Protocol-driven acquisition:
A series of voltage steps produce a characteristic current response
Online Analysis : Current-Voltage Curves Generated Automatically from Acquired Data
Protocols can be set up to perform online analysis at selected time points during the acquisition. Several online analysis programs are supplied, together with example protocols demonstrating their use. The analysis programs can be modified or extended using the built-in programming environment.
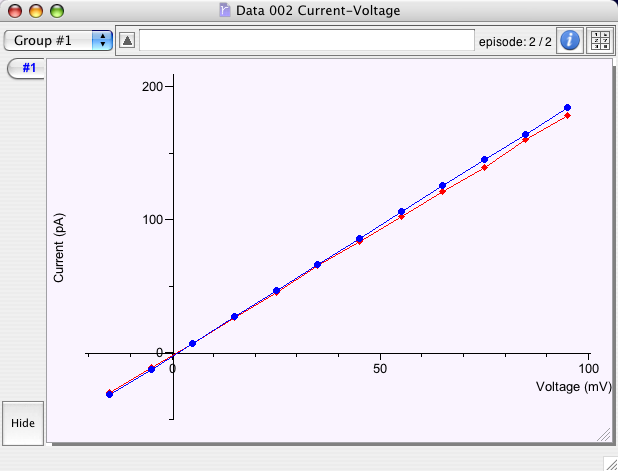
This current-voltage plot was generated automatically
as soon as the protocol finished
Hot-Keys
Hot keys are used to adjust the y-axis range of the scope or acquisition monitor during data acquisition (online). Click the "Hot Keys" button in the Acquisition toolbar for a complete list of the revised online hot keys.
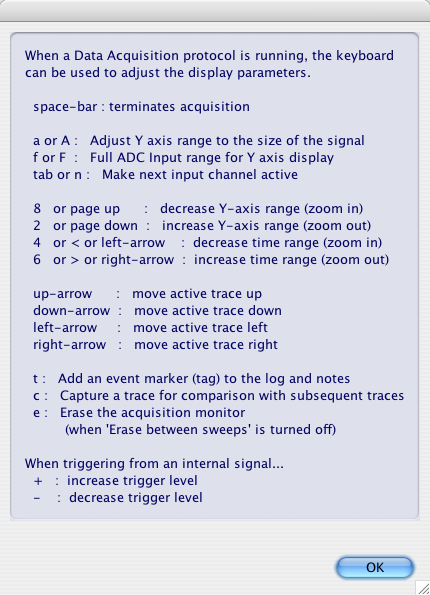
Acquisition hot-key help window
Telegraphs
AxoGraph can automatically determine the gains on input channels when acquiring data from a supported patch clamp amplifier. This is done by reading 'telegraphs' from the patch clamp device. Telegraphs can be voltage signals read from analog input channels, or messages sent from the program controlling the patch clamp.
The AxoGraph Data Acquisition system supports the following digitizers...
HEKA LIH 8+8 digitizer (USB). Currently this is the recommended digitizer to use with AxoGraph. It is fully supported on all versions of Windows and macOS / OS X.
Instrutech ITC-16, ITC-18 and ITC-1600 digitizers (USB and PCI versions). These are legacy devices, and are no longer sold by HEKA. They may potentially be found on eBay. They are fully supported on all versions of Windows and macOS / OS X.
National Instruments digitizers (USB and PCI). M-series digitizers are supported under Windows. Due to limitations in NI's driver for OS X, some digitizers are not supported, and only analog output pulses can be generated (no digital output pulses). Currently, only Windows XP and older versions of OS X are supported.
Digidata 1440A digitizer (USB) from Axon Instruments / Molecular Devices is currently supported by AxoGraph for Windows, but is not supported by AxoGraph for OS X. Currently only Windows XP is supported.
Digidata 1320 Series digitizers (PCI) from Axon Instruments / Molecular Devices. This is a legacy device, as the 1320 series is no longer sold by Molecular Devices. The Digidata shipped with a PCI SCSI adapter that is compatible with Windows PCs and Power Macs purchased before mid-2005. Newer PowerMacs and Intel-based MacPros have either a PCI-X bus or a PCI-express bus, which are not supported by MDC. However, compatible 3rd party PCI-X and PCI-express SCSI interface cards are available. Suggestions on where to purchase, and how to install these interface cards are included with AxoGraph (PDF document in the folder /Applications/AxoGraph X).
If no digitizer is installed, the Data Acquisition Package will run in demonstration mode, which simulates a whole-cell voltage-clamp recording. All acquisition features are available in demo mode, and most of the example protocols can be run.